

SUMMARY
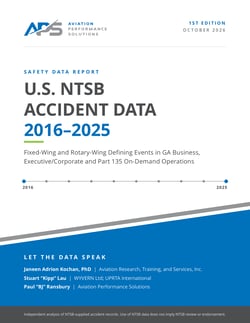
Explore ten years of NTSB-supplied accident data in an independent, APS-sponsored study of airplane and helicopter operations. Available for download as an industry resource, the report presents accident frequency and human consequence side by side.
Let the Data Speak
Which accident categories occur most often—and which account for the most lives lost? Those questions can produce different answers.
This report, NTSB Accident Analysis: Business Aviation 2016–2025, examines general aviation business, executive/corporate and Part 135 on-demand operations. It analyzes airplanes and helicopters separately, ranking NTSB defining events three ways: by fatalities, fatal accidents and total accidents. Each ranking displays all three measures, helping readers distinguish frequent occurrences from those associated with the greatest human consequences.
APS is making this resource available to pilots, flight department leaders, safety professionals, educators, researchers and anyone seeking a clearer understanding of the recorded outcomes in these operations.
What the Report Shows
The findings highlight why accident frequency alone does not tell the full story:
- Loss of Control In-Flight leads fatalities in all three fixed-wing operation categories studied.
- In fixed-wing Part 135 on-demand operations, Abnormal Runway Contact accounts for 14% of accidents but 2% of fatalities. Loss of Control In-Flight accounts for 12% of accidents and 24% of fatalities.
- In Part 135 helicopter operations, Unintended Flight Into IMC—instrument meteorological conditions—accounts for 8% of accidents but 40% of fatalities.
The report includes separate fixed-wing and rotary-wing findings, visual comparisons, full lookup tables, runway-excursion make-and-model detail, and documented methods and limitations. Supplementary sections provide estimated rates using FAA flight-hour data and context from Boeing’s worldwide commercial jet accident statistics.
Readers can use these materials to inform safety discussions, examine the findings relevant to their operation and identify questions for further investigation. The report describes recorded outcomes; it does not establish causes or prescribe safety interventions. Outcome percentages are distinct from exposure-adjusted rates, and small samples require particular caution.
Independent Authorship, APS Support
The study was independently authored by Janeen Adrion Kochan, PhD; Stuart “Kipp” Lau; and Paul “BJ” Ransbury. APS supported the project with research infrastructure and AI-assisted research and analysis tools. The authors reviewed and verified the resulting content against the underlying data and cited sources and retain responsibility for the methods, interpretations, findings and conclusions.
The documented method is designed for annual updates and adaptation to additional aviation datasets, with appropriate validation. Planned future work includes broader general aviation operations, including personal and instructional flying.
The NTSB supplied the accident records. Their use does not imply NTSB review or endorsement of the study.
Download the Report
Read the findings, examine the charts and explore the methodology behind the analysis.